#
Sentry
There is built-in support for metrics and performance tracing via Sentry performance tracing. Sentry is an open-source tracing server that also has a cloud-hosted version, thus giving you choice over how you want to handle this.
To enable tracing the following environment variables need to be set:
SENTRY_WORKER_DSN- for the worker appNEXT_PUBLIC_SENTRY_DSN- for the web app
If you want traces to be matched against source code properly you will also need to set:
SENTRY_AUTH_TOKEN
Where possible, traces will have the user wallet address attached to them so that it's easier to track a given user's requests through the system, including in session replays.
#
Spans
Traces are constructed using "spans". A span is simply a block of code which gets measured for execution time. And they can be nested to form a hierarchy.
The bootstrap object includes a startSpan method which allows you to create new span anywhere within the codebase, e.g:
// backend/db/users.ts
export const getUser = async (app: BootstrappedApp, wallet: string): Promise<User | undefined> => {
  return await app.startSpan('db.getUser', async () => {
    const ret = await app.db.user.findFirst({
      where: {
        wallet: wallet.toLowerCase(),
      },
    })

    return ret ? ret : undefined
  })
}
The end result in the Sentry viewer will look something like this, comprising hierarchical nested spans:

Built-in Node.js methods (e.g. network and file requests) are automatically traced.
#
Session replays
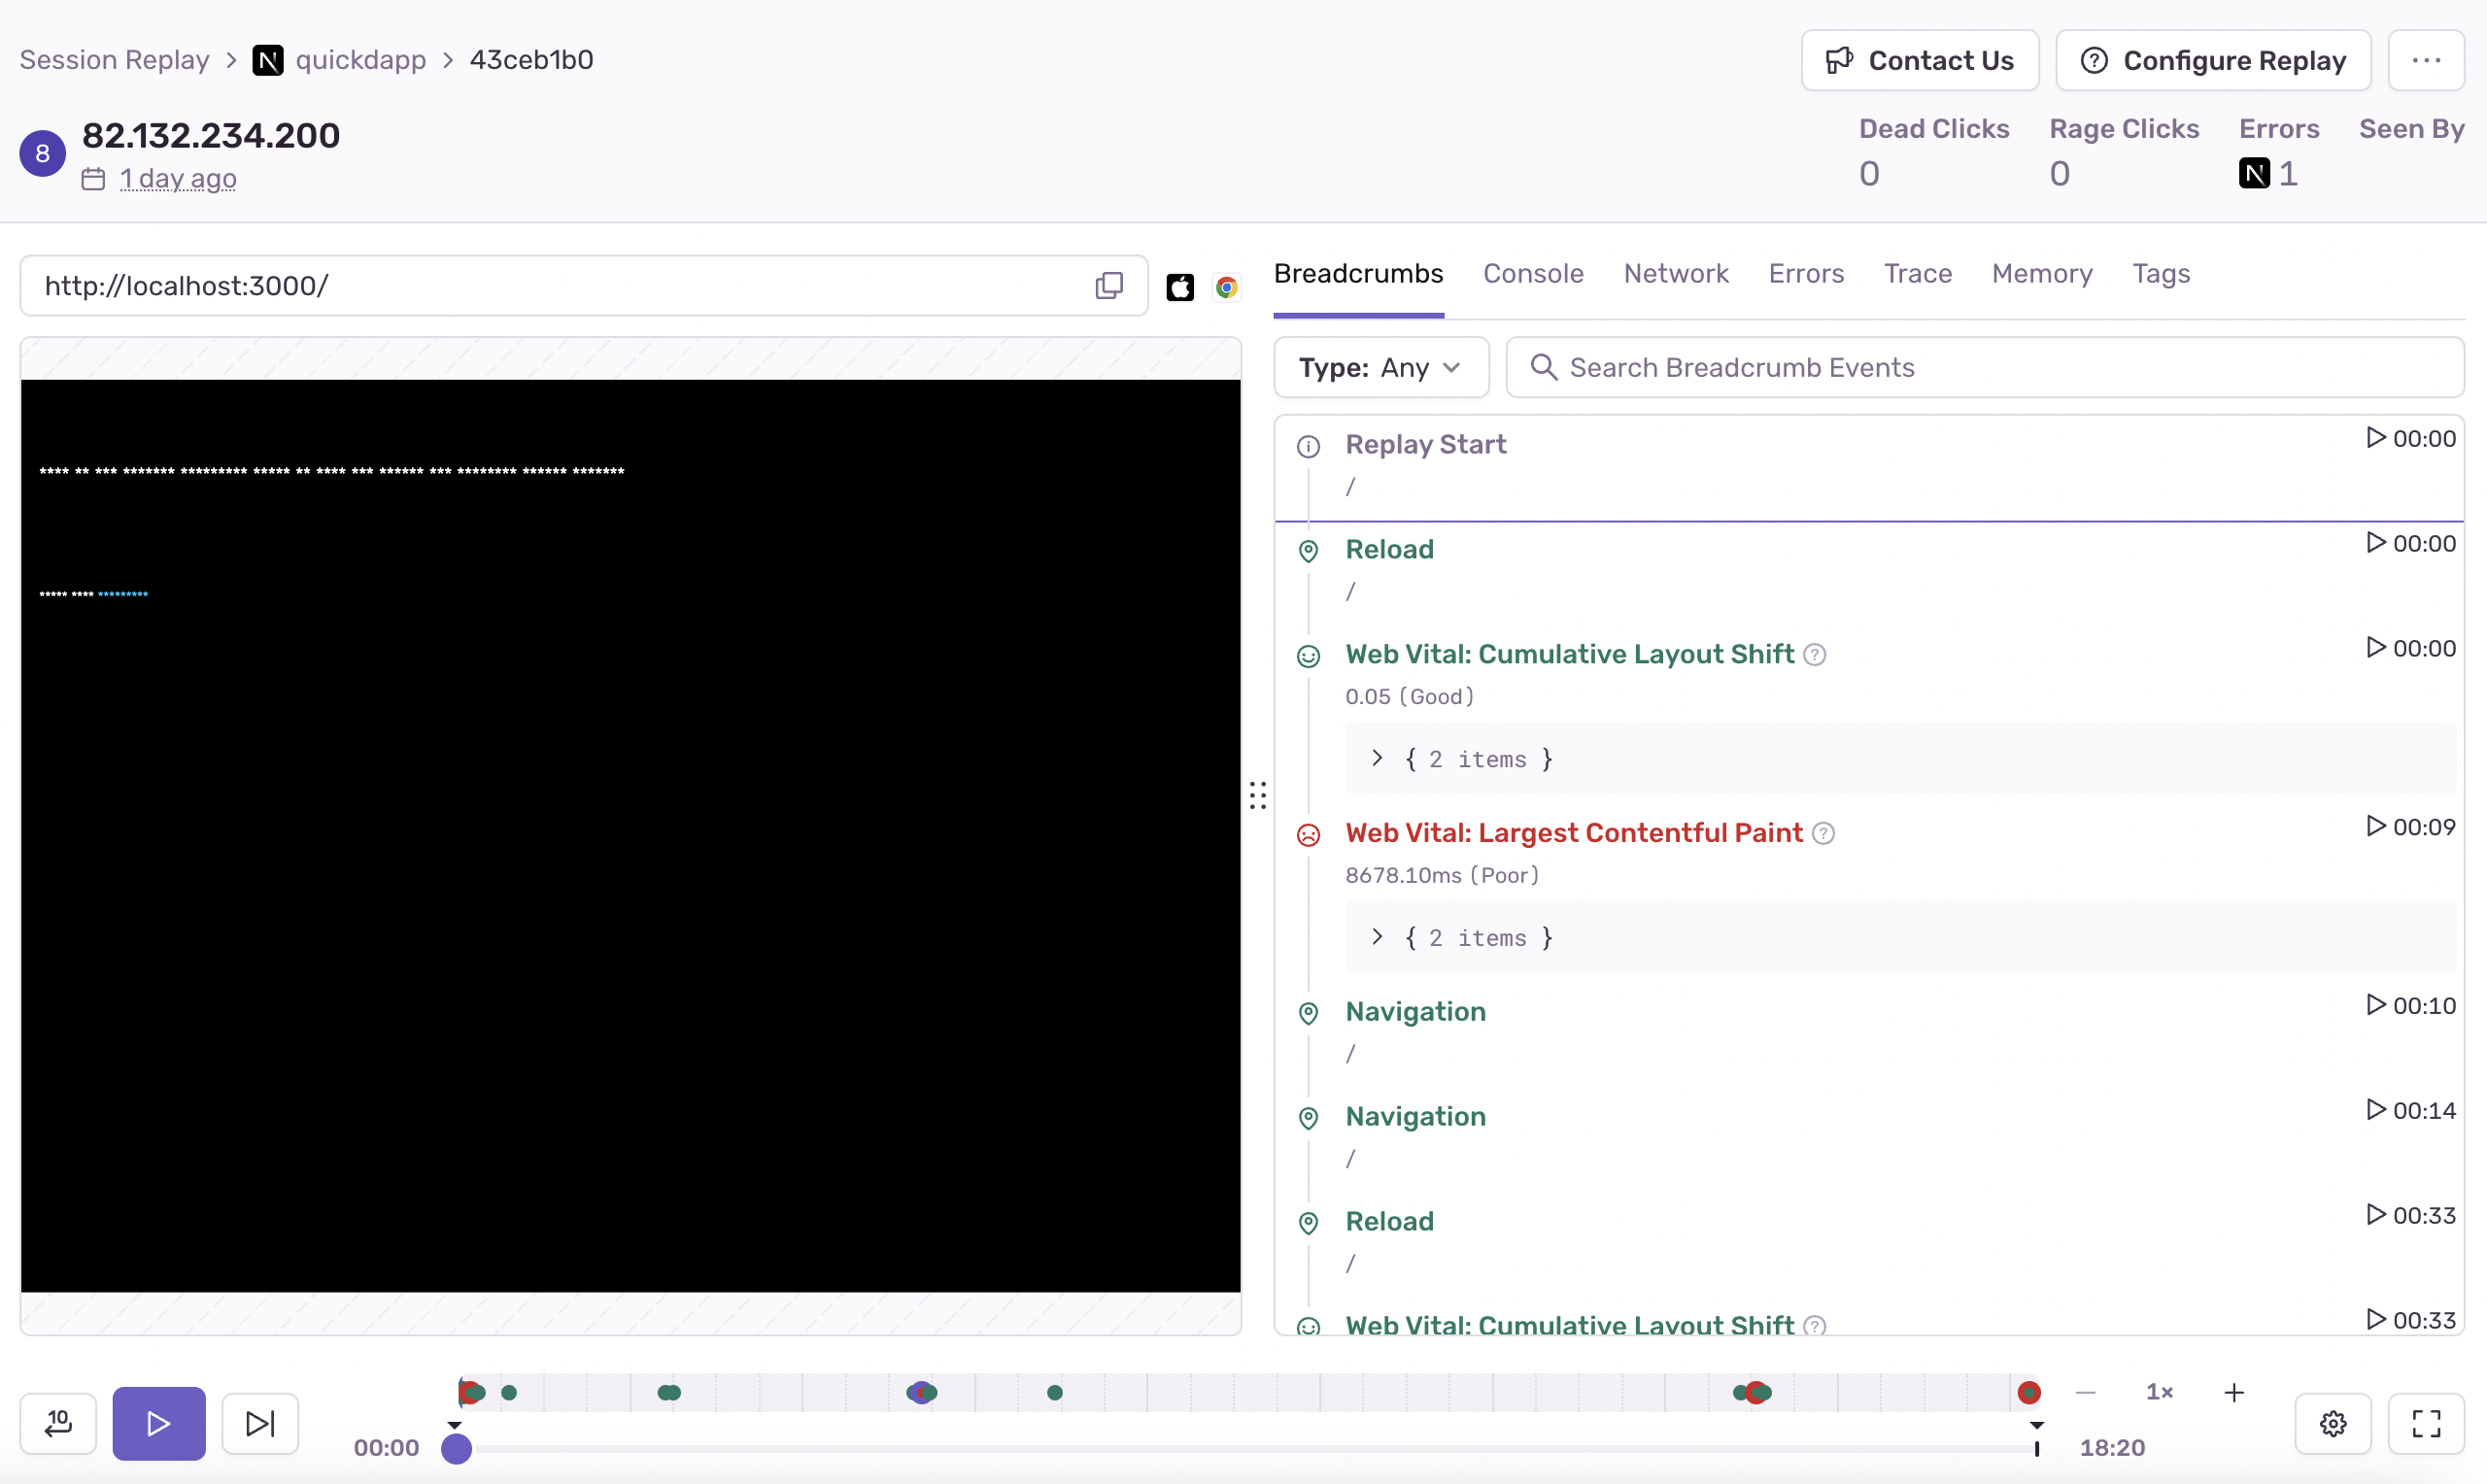
Browser session replays are also enabled by default. This allows you to see exactly what your users see when they use your dapp. This makes it easier to debug problems and figure out how to improve your UX.

#
Errors and exceptions
Most errors and exceptions are also caught and logged into Sentry. These show up as Issues in your Sentry dashboard:

